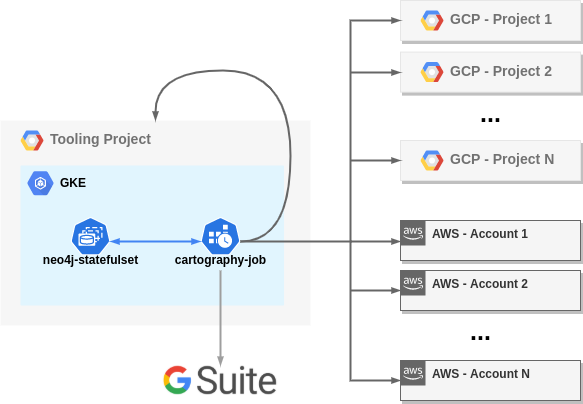
Staying on top of ephemeral environments is a challenge many organizations face. This blog post describes the process we undertook at Thought Machine, a cloud-native company with environments spanning across multiple cloud providers, to identify a solution able to detect, identify, categorize, and visualize all the cloud assets being deployed in an organization. Written by Marco Lancini, Security Engineer.
If you look for common root causes of recent security breaches, you will see that a considerable amount of them can be traced back to assets that slipped out of the organization’s inventory management, or that have been misconfigured. “The scale of cloud infrastructure is essentially infinite”: the server fleet really has no practical limit since the cloud providers operate at enormous scale. We can then gather that, nowadays, one of the core problems many organizations are facing is to keep track of all their assets.
Cartography is described as: A Python tool that consolidates infrastructure assets and the relationships between them in an intuitive graph view powered by a Neo4j database. Cartography is not the only security graph tool out there, but it differentiates itself by being fully-featured yet generic and extensible enough to help make anyone better understand their risk exposure, regardless of what platforms they use.

The article content is split into:
- The challenges posed by ephemeral environments
- Enter Cartography
- Cartography’s value proposition
- Real world setup
- Multi-cloud auditing
- Deployment on Kubernetes
- Data consumption
In this blog post we saw what benefits Cartography could have on the security posture of your organization, and author walked through the process we undertook to deploy it in a multi-cloud environment, from inception to self-service dashboards for data consumption. But there is still much to do, and Cartography still has much more to offer. Great read!
[Read More]